
Page 7 - Demo
P. 7
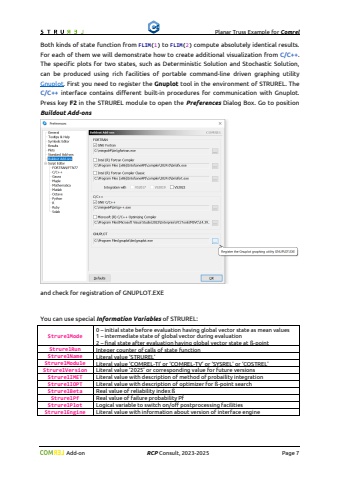
Planar Truss Example for Comrel Add-on RCP Consult, 2023-2026 Page 7Both kinds of state function from FLIM(1) to FLIM(2) compute absolutely identical results. For each of them we will demonstrate how to create additional visualization from C/C++. The specific plots for two states, such as Deterministic Solution and Stochastic Solution, can be produced using rich facilities of portable command-line driven graphing utility Gnuplot. First you need to register the Gnuplot tool in the environment of STRUREL. TheC/C++ interface contains different built-in procedures for communication with Gnuplot.Press key F2 in the STRUREL module to open the Preferences Dialog Box. Go to position Buildout Add-onsand check for registration of GNUPLOT.EXEYou can use special Information Variables of STRUREL:StrurelMode0 %u2013 initial state before evaluation having global vector state as mean values1 %u2013 intermediate state of global vector during evaluation2 %u2013 final state after evaluation having global vector state at %u00df-pointStrurelRun Integer counter of calls of state functionStrurelName Literal value %u2018STRUREL%u2019StrurelModule Literal value %u2018COMREL-TI%u2019 or %u2018COMREL-TV%u2019 or %u2018SYSREL%u2019 or %u2018COSTREL%u2019StrurelVersion Literal value %u20182026%u2019 or corresponding value for future versionsStrurelIMET Literal value with description of method of probaility integrationStrurelIOPT Literal value with description of optimizer for %u00df-point searchStrurelBeta Real value of reliability index %u00dfStrurelPf Real value of failure probability PfStrurelEngine Literal value with information about version of interface engineStrurelPlot Logical variable to switch on/off postprocessing facilitiesStrurelPlotName Literal value for a base name of file for plot drawn in interface engineStrurelPlotType Literal value for an extension of file for plot drawn in interface engineStrurelPlotMode1 %u2013 shows a generated plot in a separate window2 %u2013 saves a generated plot in a file with format defined by an plot extension3 %u2013 combines mode 1 and mode 2StrurelPlotCount Integer counter of plots drawn on run. Default is 0
